
Project information
- Category: Data Analysis
- Client: a fictional Top Movie Studio
- Project URL: Box Office Success Determinants Repository
Introduction
As Data Scientists we are equipped to answer a variety of questions, including questions that might seem to have an obvious solution, but in fact they are not easily answered. Usually, this kind of answers come in various forms, such as recommendations. As part of my mentorship, I was tasked to imagine being a Data Scientist for a Top Movie Studio. Now, this Movie Studio had an unfortunate series of Box Office flops, and naturally the producers decided to question their strategy. In their search for answers, they turned to their friendly neighborhood Data Scientist, where I suggested a new approach: using data to determine what factors go into making a successful film. Luckily, we had a dataset of over 5000 films to mine for insights. My producers asked me to spend some time analyzing the data and present a report detailing my findings, along with recommendations on how to revamp the studio’s strategy.
Firstly, I made a couple of assumptions on what I think what makes a movie a success. It must be the budget, right? If the budget is high enough, the movie will surely make money. What about hiring top-notch directors and producers? They know their job. And of course, I will always watch every Meryl Streep movie, for me that’s a sell right there. Does the choice of actors really sells the movie? Also, I don’t really prefer dramas, but I will watch them if they are scored high enough on IMDB. I like horror movies, but all my friends and family mostly watch adventure and action movies. Does the genre matter when it comes to profit? I will dive into these assumptions, and investigate if and how well they hold. Based on my findings, I will make recommendations for the studio.
Structure and The Data
This is a descriptive blog post that follows the data analysis done for the project. I will not include code in this post. You can find all additional information about the project and the code in this repository.
The project was done using Python, Numpy, Pandas, Matplotlib, Seaborn, and NLTK.
The data was originally taken from Kaggle, but it is also available in the repositories’ data folder.
This blog post will only focus on exploring, answering the project’s goals, and making recommendations. The data preprocessing stage is presented as a separate blog post that you can find here.
The Project Goal
To make the analysis of the dataset more feasible, I converted some of my assumptions to a set of questions that will drive answers and recommendations. These questions are as follows:
- What is the correlation between budget and profit? Which budget ranges should be considered for making a Box Office success?
- Do actors/actresses and directors play a role in a movie’s success?
- How does a movie’s score rating impact profit?
- How does the trend of profit, revenue, profit margin, and other attributes change over years, and can it be relevant to future strategy?
- How do genres play in with profit and profit margin?
- Is there a pattern in common plot keywords with successful movies?
- Are duration and content rating relevant to profit?
- What can we learn from number of votes, and critic reviews in regard to genres and profit?
Feature Engineering
For the purpose of the analysis, I needed to derive new features that will help me measure the success of a movie in different ways. I used Feature engineering in the process, and created the following features:
- Profit — is defined as a financial gain, especially the difference between the amount earned, and the amount spent in buying, operating, or producing something. In our case, it is very valuable to learn in terms of budget and revenue.
- Return of Investment (ROI) — is a popular profitability metric used to evaluate how well an investment has performed. ROI tries to directly measure the amount of return on a particular investment, relative to the investment’s cost.
- Profit Margin — shows the overall ability to turn income into profit.
- Value Above Replacement (VAR) — is a statistics I found from jeremy-lee93 and included it in my analysis as I found it to be very useful, and it is an adapted version of VORP. It basically measures the number of times an actor/actress or a director appeared in movies with an above average profit. As an example, an actor has a VAR = 2 if the average profit from his movies is $200, compared to the average profit of all movies, which is $100.
What is the correlation between budget and profit? Which budget ranges should be considered for making a Box Office success?
Budget and profit show a coherent positive linear relationship, which means that the higher the budget, the higher the profit of a movie. However, the trend line showing the relationship between profit margin and budget is negative, which can be explained by the following: if you spend too much money on making a movie, you can potentially decrease your profit margin. When I visualize the relationship between budget and profit using top 30 most profitable movies, I can see a clear perspective of the above-mentioned trend:
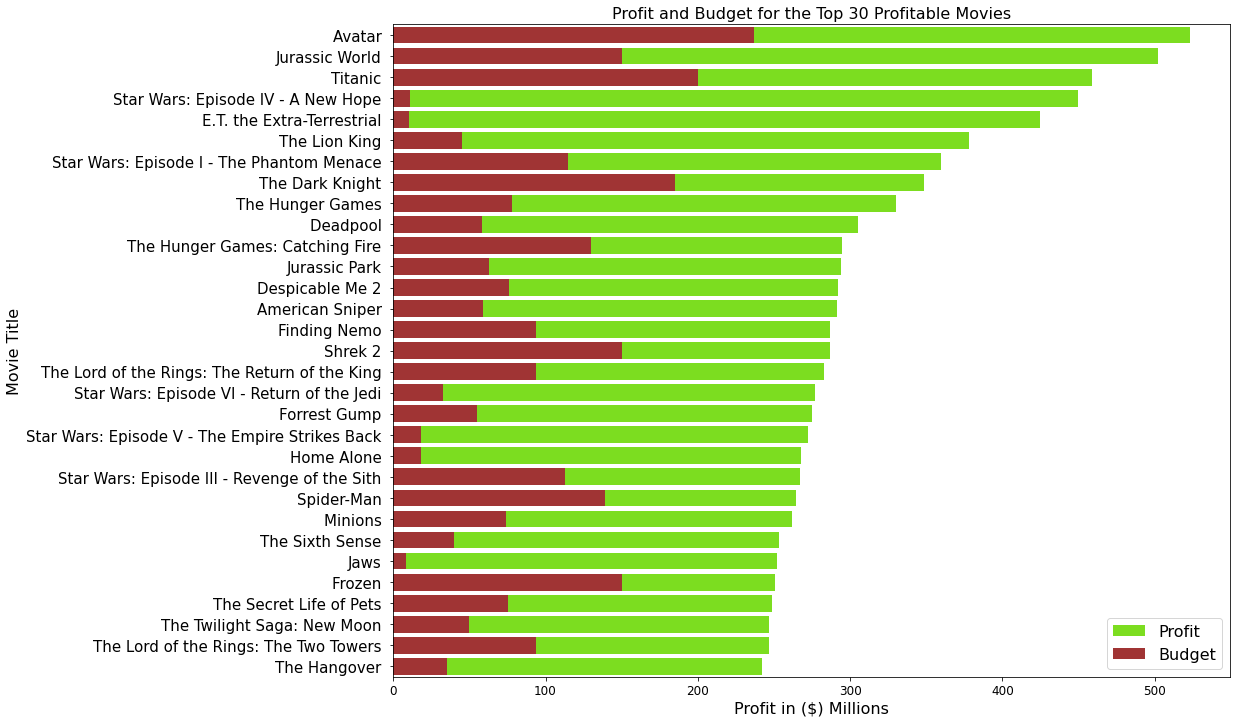
Strategy recommendation: I recommend that the optimal budget value for making a successful movie should not be less than $40 MM, and on average I recommend it to be somewhere around $75 MM, as on average these budgets result with a good profit margin above 0.6.(This recommendation was made based on a profit margin greater than 0.6.) There is evidence that higher budget movies risk a smaller profit margin, as shown in the analysis, therefore I cannot support the claim that large budgets are a certain indicator of a Box Office success.
Do actors/actresses and directors play a role in a movie’s success?
I visualized the VAR score of the top 30 actors and actresses that appeared in at least 5 movies. The results are quite interesting:
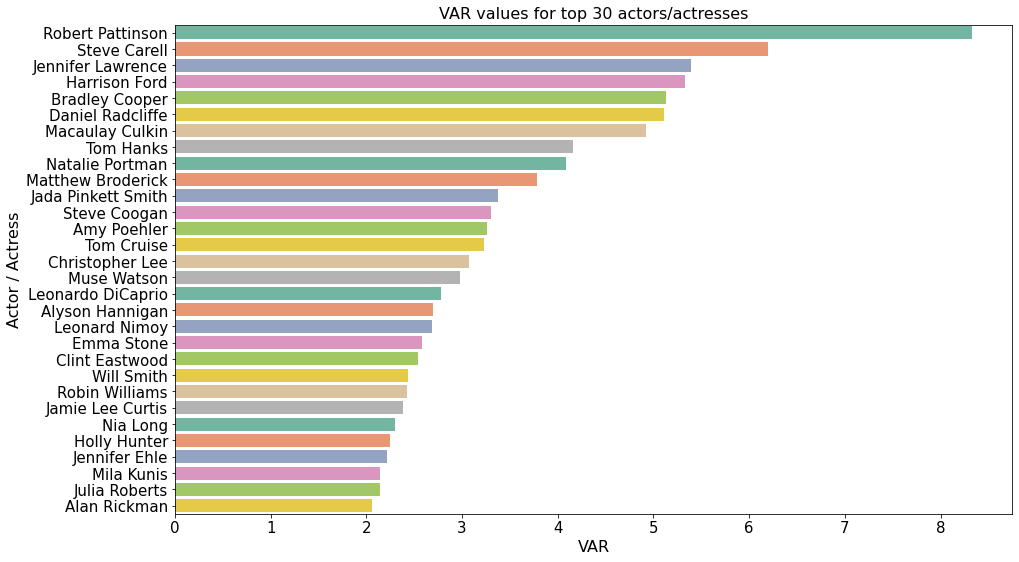
It appears Robert Pattison brings 9 times the average profit value in movies! That is quite impressive. He is followed by Steve Carell and Jennifer Lawrence with pretty high VAR scores. I can conclude that having a good VAR rated actor or an actress does impact a movie’s profit. Now let’s see which values do directors bring to a movie, having directed at least 3 movies:
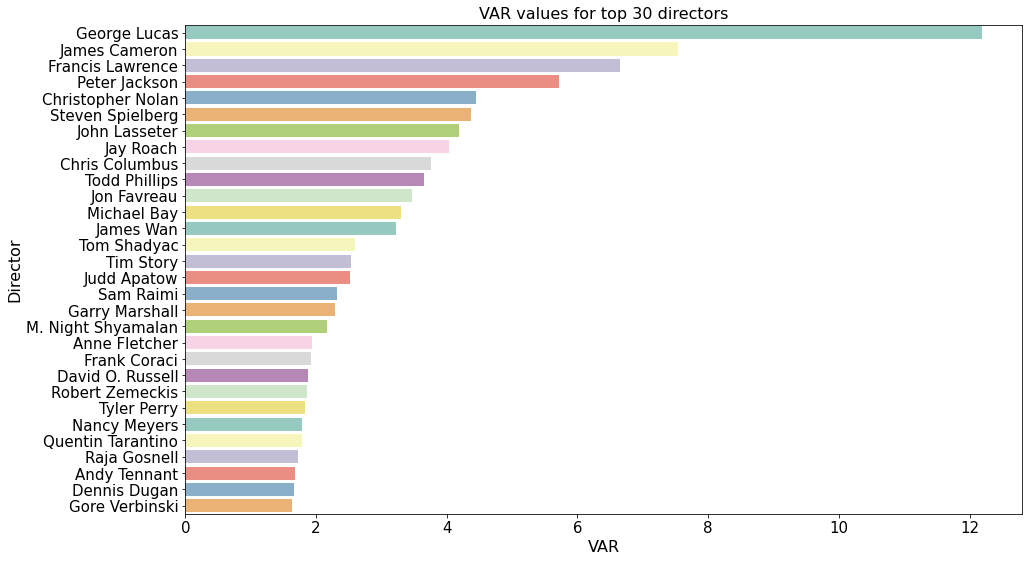
It appears that having a good VAR score rated director is even more valuable to a movie’s profit, than that of an actor or an actress. George Lucas scored an impressive 12 times the average profit value! And all top 30 directors visualized above bring more than average net profit to a movie.
Strategy recommendation: With great certainty, I can recommend that the studio takes into account the VAR score of an actor or an actress when hiring, and even more so the VAR score of the person who will direct the movie: For actors and actresses, I recommend a range value of VAR between 1.0 and 3.0.For directors, I recommend a range value of VAR between 1.0 and 2.50
How does a movie’s score rating impact profit?
When I am deciding on which movie to watch, I always check on its IMDB score. It tells me a very simple information: do people think that this movie is worth watching? I decided to visualize movies with scores above 7, and their upper and lower profit ends, and see if there is a trend:
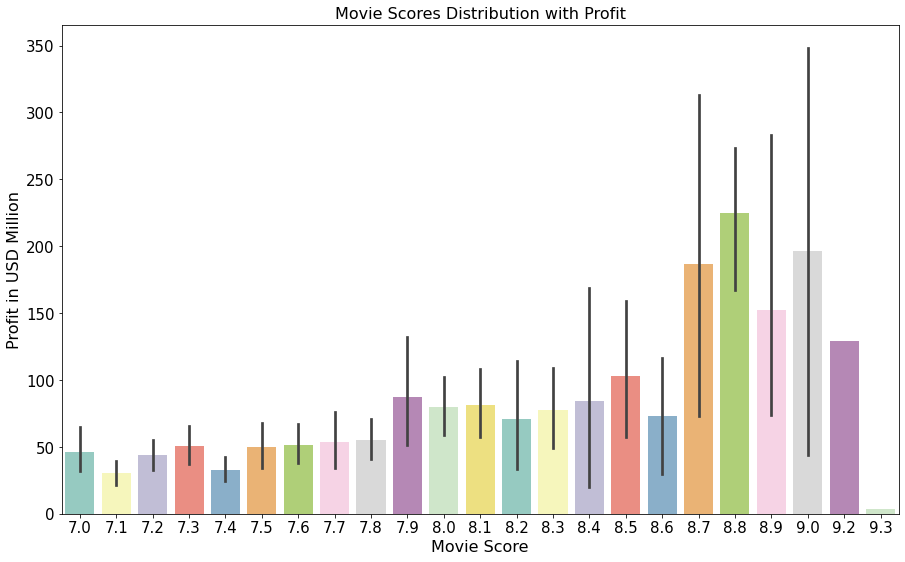
There is a trend: movies with higher profits score higher among its audience. Now, I would like to see how do movies score among top 20 directors with at least 5 movies in their career:
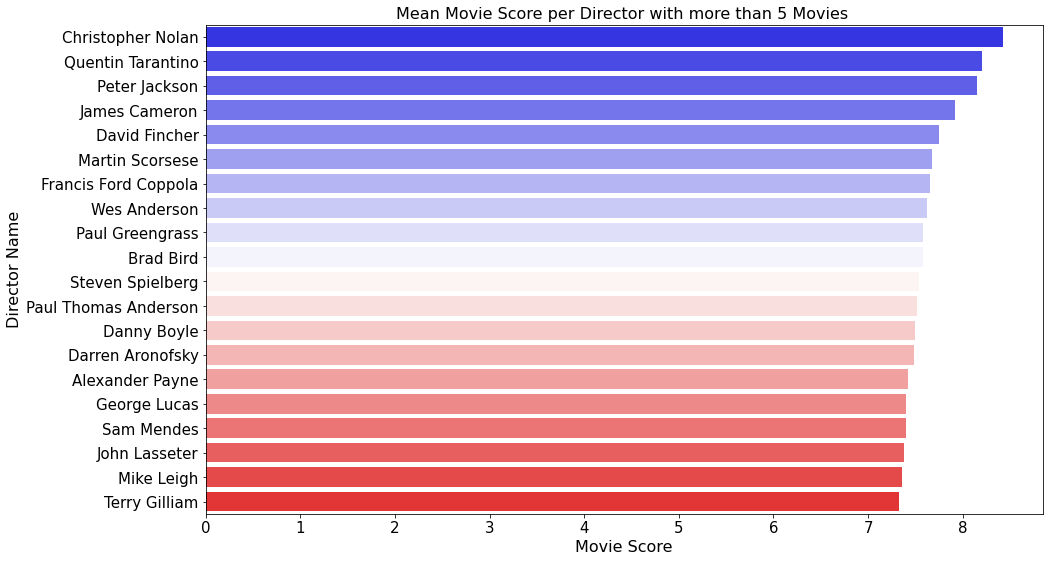
I definitely see names from our VAR histogram above! There is undoubtedly room for a recommendation based on a mean score a director’s movies have.
Strategy recommendation: I recommend taking into account the average movie scores (not less than 7.0) of a director, when hiring one. I consider it might have a positive impact on profit. Another recommendation regarding movie scores will be in relation to movie’s genre, and will be detailed later in the report.
How does the trend of profit, revenue, profit margin, and other attributes change over years, and can it be relevant to future strategy?
In order to learn about trends that happened over almost 100 years of the movie industry, I considered the whole sample size in the period from 1929 till 2016. The general trend of number of movies made per year looks like this:
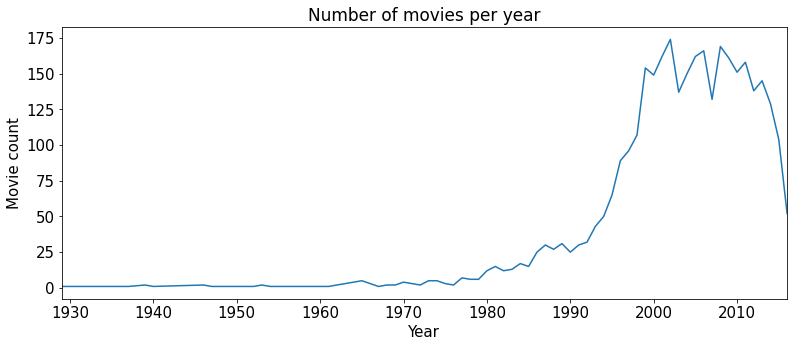
I disregarded the obvious drop in the number of movies at the end of 2016, as our sample size only contains a small amount of movies made in 2016, and cannot be taken into account. I identified a sharp rise in the ’90s, as the industry started to bloom, and is in accordance with the technological advances happening at the time. The new millennium brought us somewhere from 125 to 175 English-speaking movies per year.
Let’s see some trends in budget values, revenues, and profit over years:

I’m guessing the first thing you saw was that huge spike in profit and gross plots somewhere around the year 1940. Well, the three huge Box Office successes responsible for the spike in that period were Gone with the Wind with an astounding $194.6MM profit, Snow White and the Seven Dwarfs with an equally impressive $182.9MM profit, and Pinocchio with $81.7MM profit. Now, another thing you might have noticed is that budget values are on a constant rise since the ’70s, and are at their highest at the moment. However, profit is not following the rising trend. Let’s see these two variables in close up:
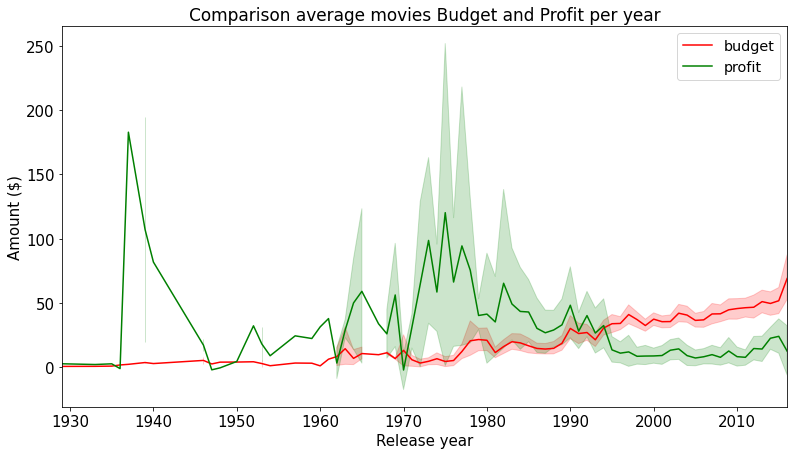
Profit is slightly decreasing since mid ’90s, and the budget values are rising. I can hypothesize that costly technology and staff needed for creating a feature movie is costing more than before, however I do not have the data needed to support this hypothesis at the moment, and it is out of scope for this project.
Strategy recommendation: I have no relevant recommendations to make at this time regarding trends over years.
How do genres play in with profit and profit margin?
Everyone has a favorite movie genre, and it might be safe to assume that the choice of a movie’s genre can play an important role in terms of profitability. I will check this assumption, but first I would like to see which genres are most commonly produced:
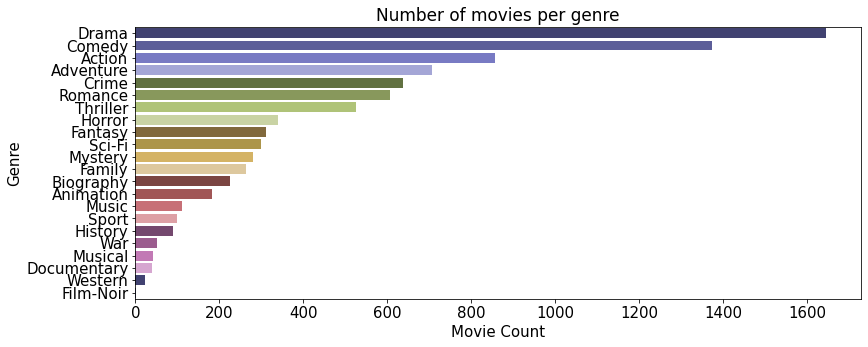
Comedy, Action, Drama, and Adventure are the most common genre in the dataset. As a huge horror fan, I was hoping it would rank higher. Oh, well. I also wanted to visualize movie genres in combination with their profit, ROI, budget, and profit margin values, and see if I can spot any pattern:
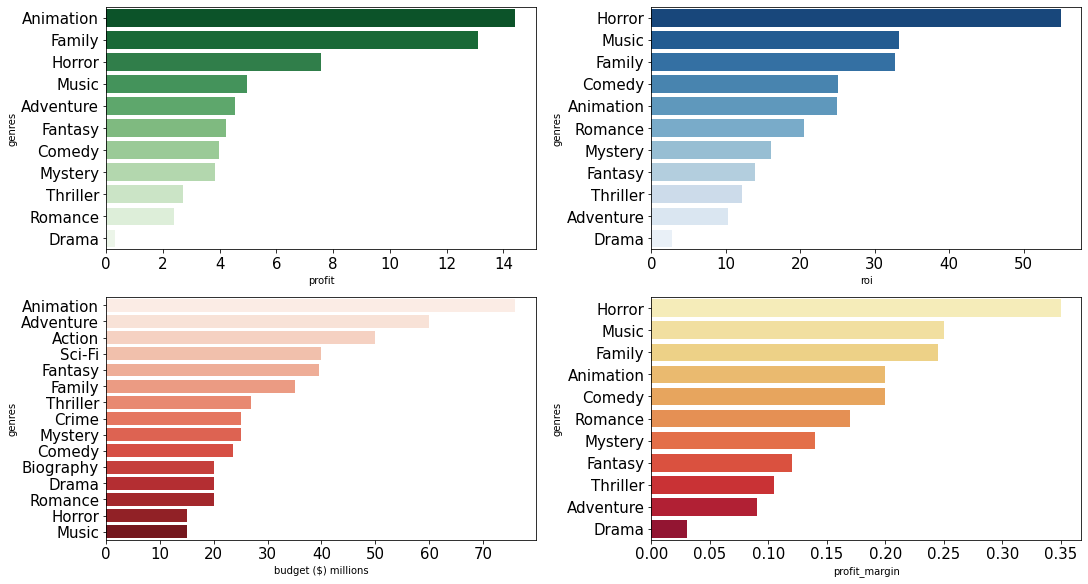
The Animation genre is highly profitable, but also expensive to make. I also see the Family genre among the top profitable, and not as expensive to make, with a reasonable Return of Investment. Interestingly enough, the Horror genre leads by almost a half in terms of ROI, and the profit margin. However, I did not take the profit margin plot into account, as it only shows values below 0.35 margin. Drama ranks low in almost all plots, and it was the most common genre present in our sample size.
What are the average movie scores of different genres?
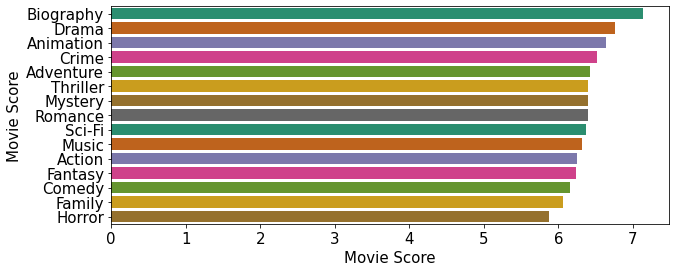
It appears that Biographies often score high, as well as Drama genres. Animation movies have a good average score, however the Horror genre is rated quite low on average — below 6. Both Animation and Adventure genres rate above 6 on average among the audiences.
Strategy recommendation: I recommend investing in the Animation genre, in the above-mentioned budget range of $40MM to $75MM, as well as Family and Adventure genres, as they show a desirable Return Of Investment, and are not as expensive. Those genres can be on the lower end of the budget recommendations — $40MM.
Is there a pattern in common plot keywords with successful movies?
To be able to answer this question, I filtered out the most profitable movies, with the profit margin being above 0.6, and created a box-plot visualization of the most common plot keywords found in those movies. Here is the result:
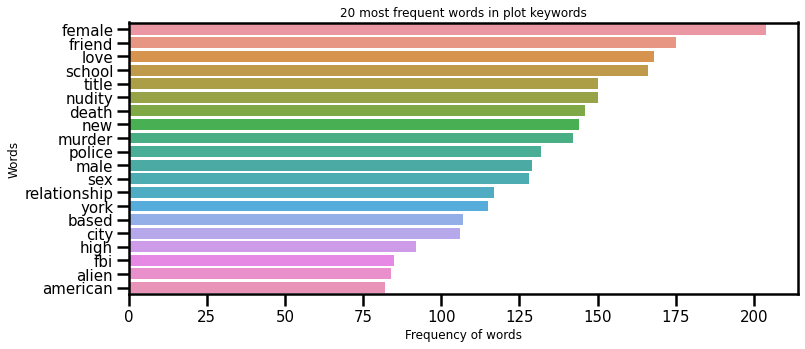
Unfortunately, I was not able to find any relevant information to the project’s goal, as the context of resulted words is too broad to be able to find a pattern.
Are duration and content rating relevant to profit?
By exploring the distribution of movie’s duration, I can learn the duration ranges of the majority of movies. It is always better to visualize it, in order to make a relevant conclusion:
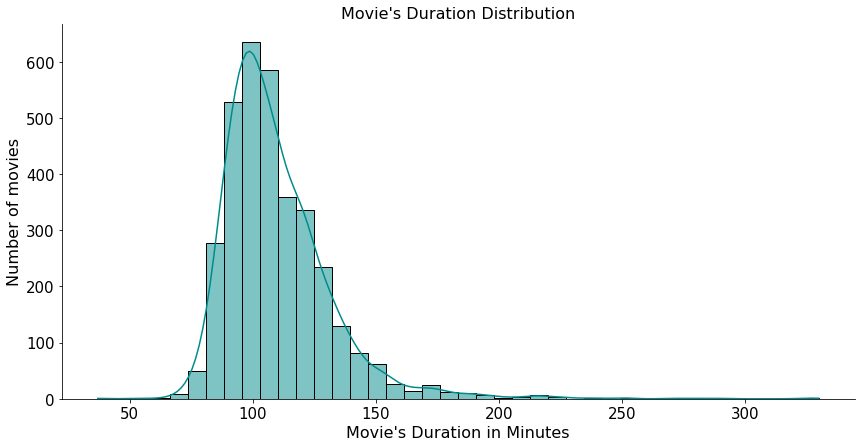
The duration of most movies falls between 90 and 120 minutes, and let’s see how well these movies score among audiences:

It appears that movies that last at least 150 minutes, usually score better with scores above 7.5. However, in order to find out the relationship between these two features, I calculated their correlation score, and the resulted score was very low, which means the relationship between movie scores and their duration is not significant.
When analyzing most common content ratings, and the number of movies, it is clear that the R rated movies are the majority:
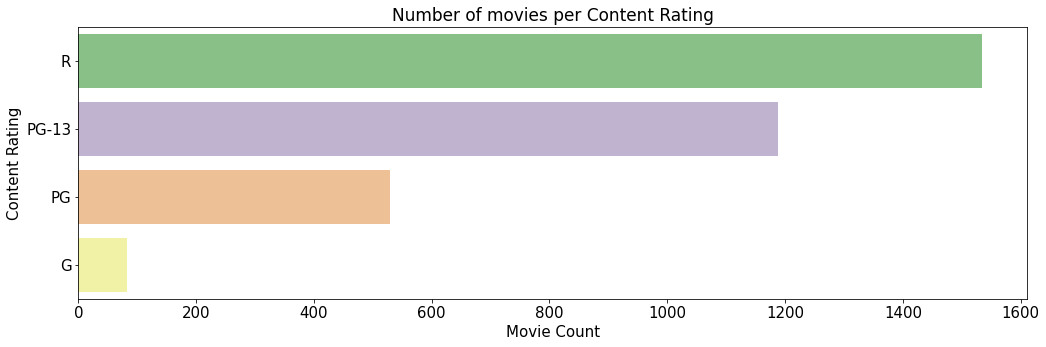
Average scores of movies are around 6.3, and unfortunately, this is not a certain indicator of a potential recommendation. PG-13 content rating is however also largely present in the market, which corresponds with the above findings of profitable genres like Animation, Adventure, and Family.
Strategy recommendation: The studio should focus on PG-13 movies, as the most common profitable genres (Animation, Adventure, Family) are in this group.
What can we learn from number of votes, and critic reviews in regard to genres and profit?
In the dataset I found information on number of users voted for a specific movie title, as well as information on number of critic reviews, and user reviews. However, scales differed greatly, as the total number of votes averaged around 100K, and for user reviews only around 330, and critic reviews 160. Therefore, I will only take into account genres that have the highest number of votes, as well as reviews. The following visualization shows us the number of votes per genre:
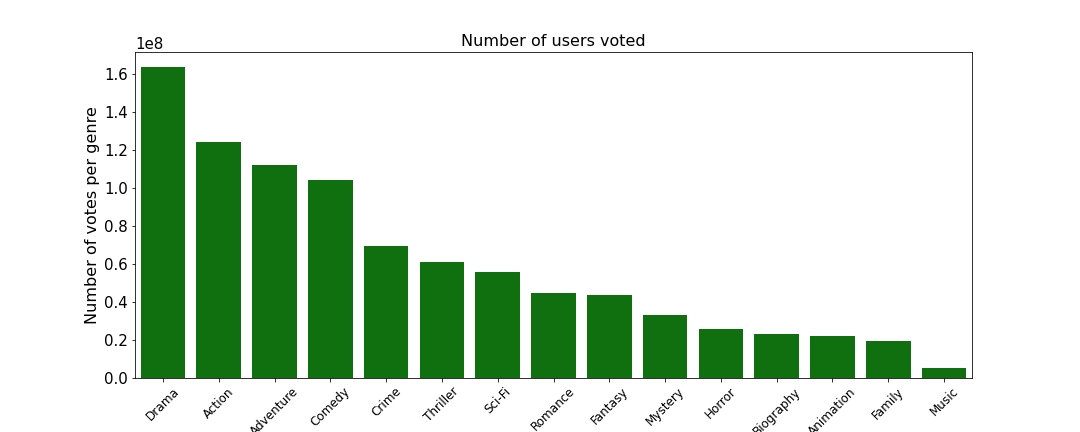
The popularity of Drama, Action, Adventure, and Comedy genres is shown again in the above plot, and it makes sense with our previous findings that most movies made are among these four genres. However, Animation genre seems to be less voted on, at this stage I can only speculate why, as I do not have the demographic information of users who voted.
The next visualization shows the number of critic and user reviews for each genre, and the results are very similar to the plot above:
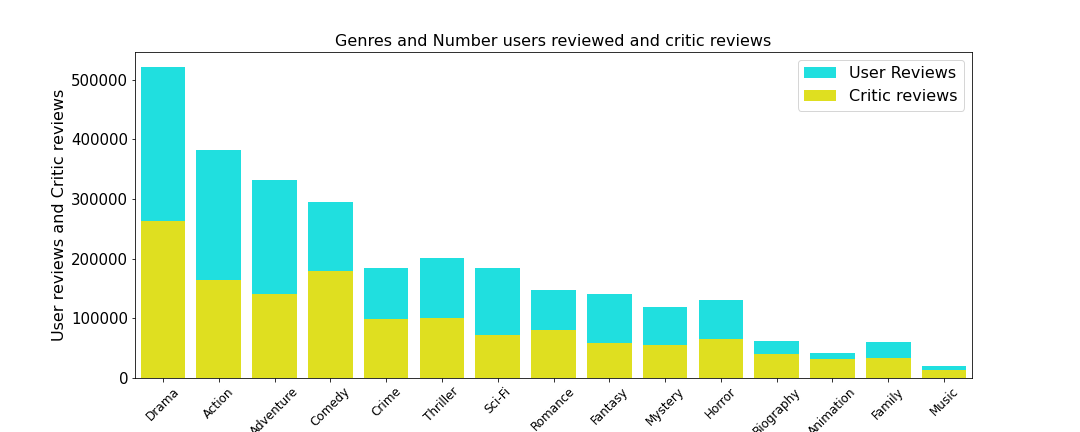
Strategy recommendation: There are no significant strategies to be recommended at this moment, without having specific demographic information about users voted, users reviews, and number of critic reviews.
Conclusion
The Top Movie Studio producers stated a great business question: What are we doing wrong, and what can we do to change our strategy? Fortunately for them, there are many answers to the question, and some of them were presented in this project. I would separate a couple of important recommendations as part of this conclusion.
The data available showed that budget values between $40 MM and $75 MM, for a good profit margin of 0.6. The most profitable genres are Animation, Adventure, and Family — all three are PG-13 content rating. Also, included in the recommendation, is the importance of directors and actors/actresses. Directors with an average movie score above 7 show great potential to bring significant value to a movie, even so if their VAR score is between 1.0 and 2.5. The same goes for actors/actresses — if their VAR score is between 1.0 and 3.0, they will bring value to a movie.
As the quest for a more detailed analysis and answers is always on, I will include a couple of Future recommendations that I deem to be potentially valuable to the studio.
Future recommendations
I recommend including and exploring data on Oscar winning directors, actors/actresses, and movies. During my time working on this project, I wondered if creating sequels is a good opportunity for a successful movie — this is something I would also consider including. Besides that, I would also add demographic information of users if applicable, and other movie studio box office successes in the dataset in order to obtain more detailed analysis. I believe this information would bring additional insight into assessing determinants of a Box Office success.